
Whenever I see the water line spike on the
National Weather Service Hydrologic Chart I know that soon there will be water seeping into the basement.

Flood stage is 9 feet and that's when water begins to appear along the cracks. The amount of water infiltrating depends on how long or how high the water table is up.

This is Prairie Creek looking West. Before I found the NWS hydrograph I determined that when the water rose to the bottom of the bridge's arch, the basement would begin to flood.
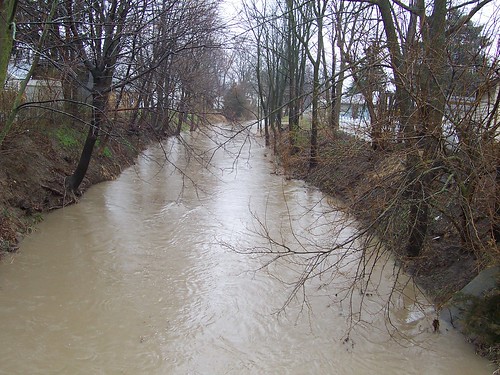
And this is the same bridge looking East. Yep, that's Moderate Flood Stage, a full eleven feet deep and flowing fast. Hard to believe that most days you can see the bottom of the creek.
I tried every place I could think to look, but I couldn't find that same data for my area - 19947. Is there a magic trick for finding this out? We have a very high water table here and I'd like to be able to keep track of it with a graph like that! Thanks for any help you can give!
ReplyDelete